Blog Credit : Twinmotion
- Effective urban planning is about more than redesigning cities and towns. At its core, it’s about local democracy —the idea that the people who use a space—and whose taxes go towards its development—should have a stake in it.
- Public participation is widely regarded as critical for ethical—and successful—urban planning. When residents are given an insight into the development process, the community takes better care of the area, demonstrates greater goodwill towards the project, and enjoys a higher level of user satisfaction once it’s completed. Because of this, the way proposed infrastructure works are communicated is incredibly important.
- Previously, local authorities might have relied solely on pencil-drawn sketches or miniature models to explain their plans. Now, interactive 3D tools enable them to provide compelling animations to go alongside static renders. These real-time visualizations provide a much more accurate sense of how the development will change the area.
Fast and effective urban planning visualisation
- Nestled among the pine forests of south-west France lies Sophia Antipolis, the French Riviera's answer to California's Silicon Valley. It might seem like an unlikely spot for global technology giants and high-tech startups—but since its opening in 1969, Sophia Antipolis has attracted big names in technology, including Amadeus, Cisco, IBM, and Microsoft.
- The whole place is laid out as a park, with a notable absence of straight roads and an abundance of trees. In fact, two thirds of Sophia Antipolis is maintained as green areas. There’s also a firm sense of belonging—people based here identify strongly with the place, even calling themselves “Sophiepolitans”.
- Given the residents' pride in the area, it’s understandable that when the region’s administrative authority wanted to undertake major infrastructure works, they needed an effective way to communicate the plans to the public.
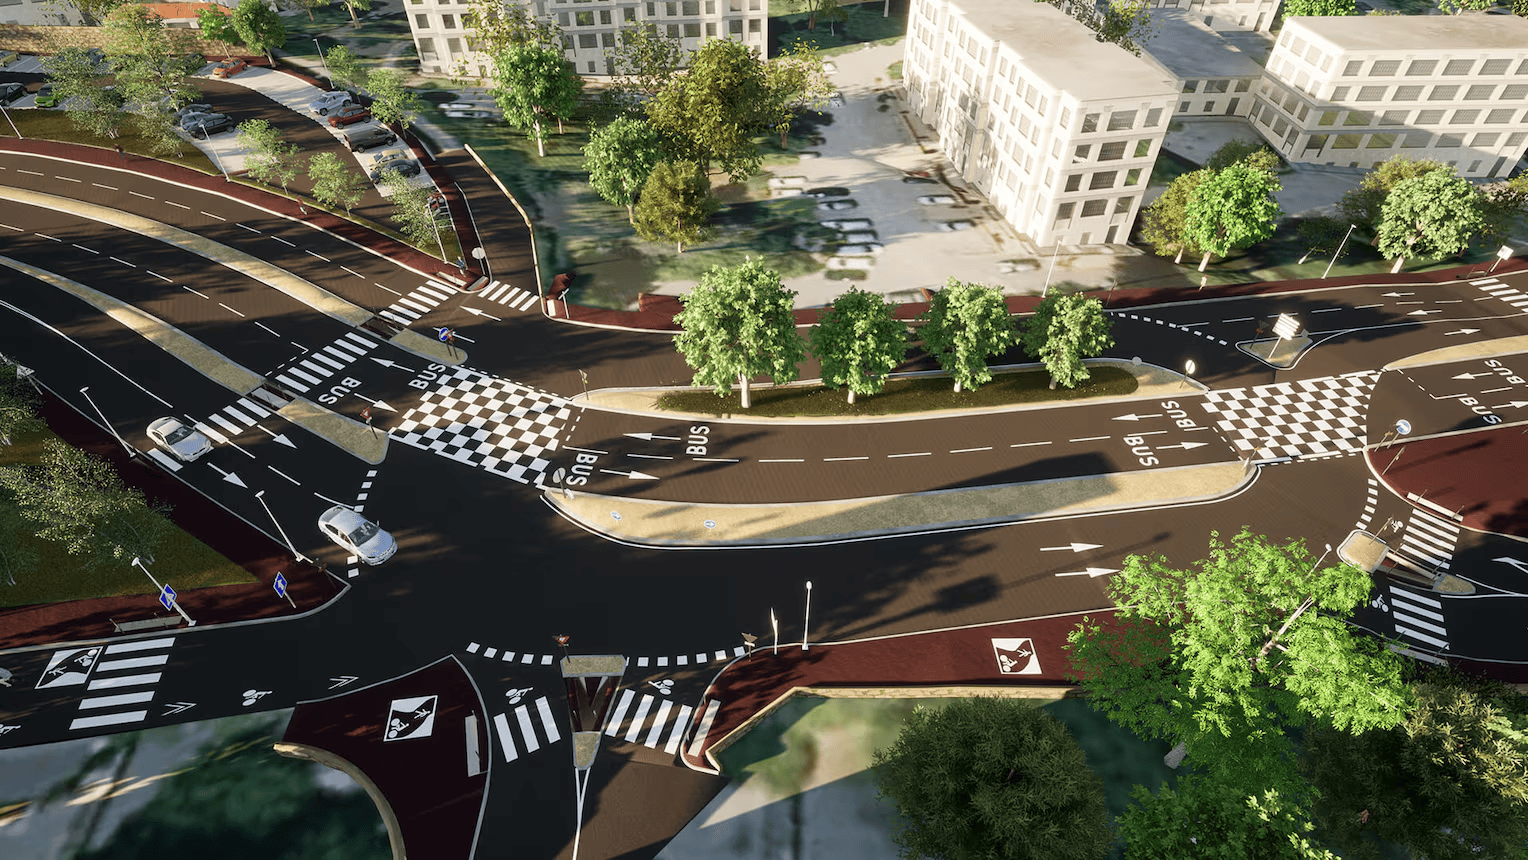
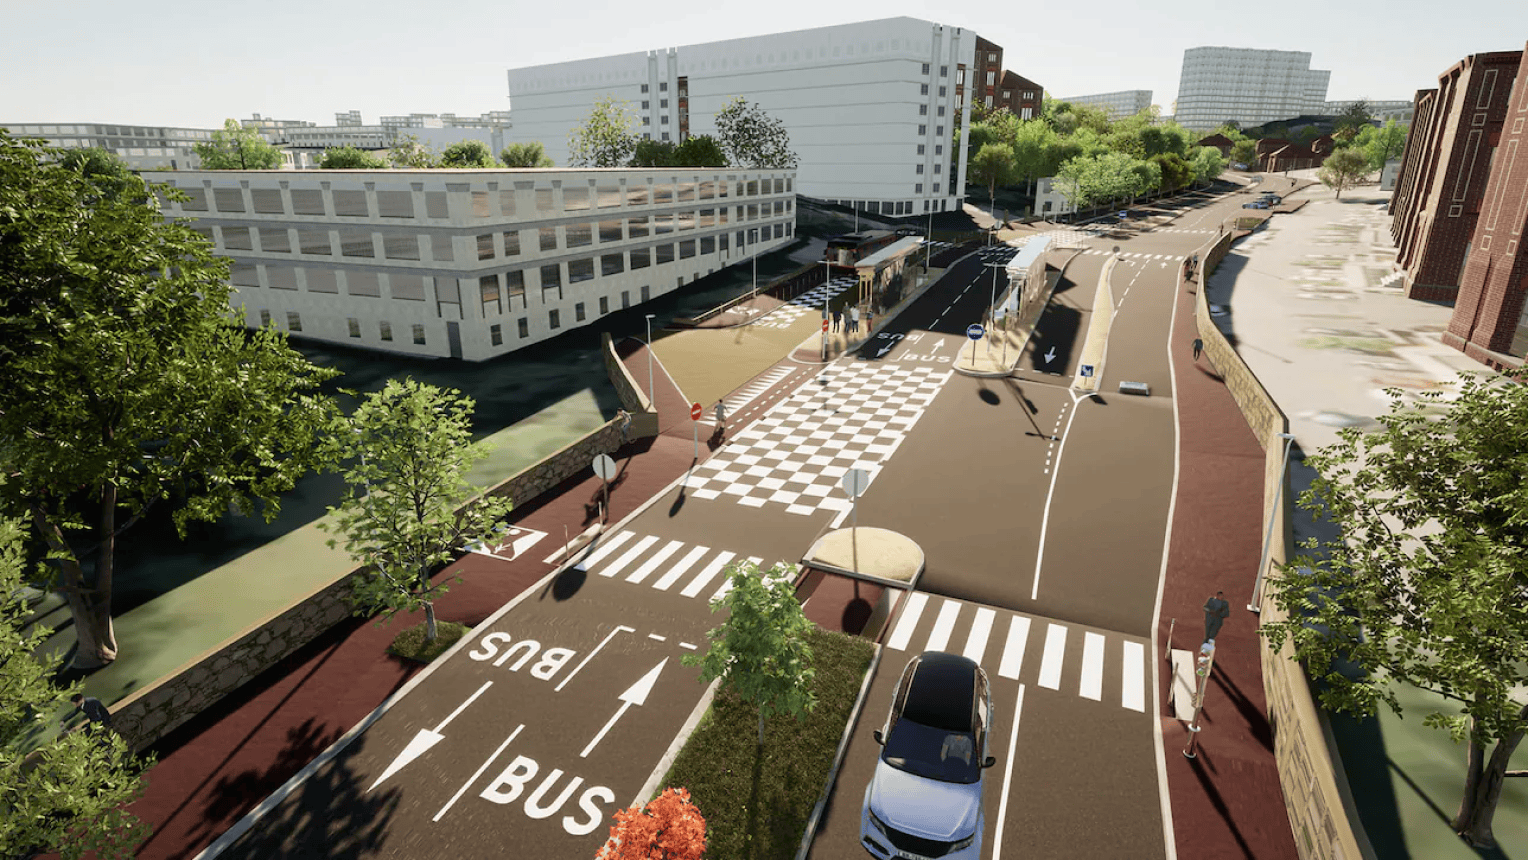
- The works proposed by the Sophia Antipolis Agglomeration Community (CASA) were for a new bus and tram route infrastructure. Designed to take the pressure off Sophia Antipolis’ transport network as the technology park grows, the bus/tram route includes 17 new stations, along with cycle lanes. The entire project has to deliver on a promise of sustainable development.
- To help the public understand its proposed plans, CASA commissioned Egis, a major international group involved in the construction, engineering, and mobility services sectors, to deliver a range of communication materials, as well as infrastructure studies. These would showcase a major section of the bus and tram route, and include a mix of video and still images.
- The Egis team opted to use fast archviz tool Twinmotion to create these assets. While Twinmotion is perhaps best known for its efficacy in creating smaller residential visualizations, it’s increasingly proving its scalability on larger urban development projects like this.
Bringing different datasets together easily.
- Egis’ first task was to digitally replicate the areas of Sophia Antipolis that would be affected by the development. It created a model of the works’ contextual environment based on data from OpenStreetMap—a global collaborative mapping project—combined with data from a topographic survey that was carried out on site to improve the accuracy of the digital model.
- The building models lining the bus-tram route were also created using open data and textured with façades from InfraWorks, Autodesk’s civil infrastructure design tool. The team created the models for the proposed new roads and infrastructure facilities from scratch using BIM infrastructure software Mensura Genius. Models from these and other third-party tools were exported to Twinmotion as IFC, SKP, and FBX files. “Data transfer to Twinmotion was pretty easy,” says William Weltzer, Project Engineer at Egis.
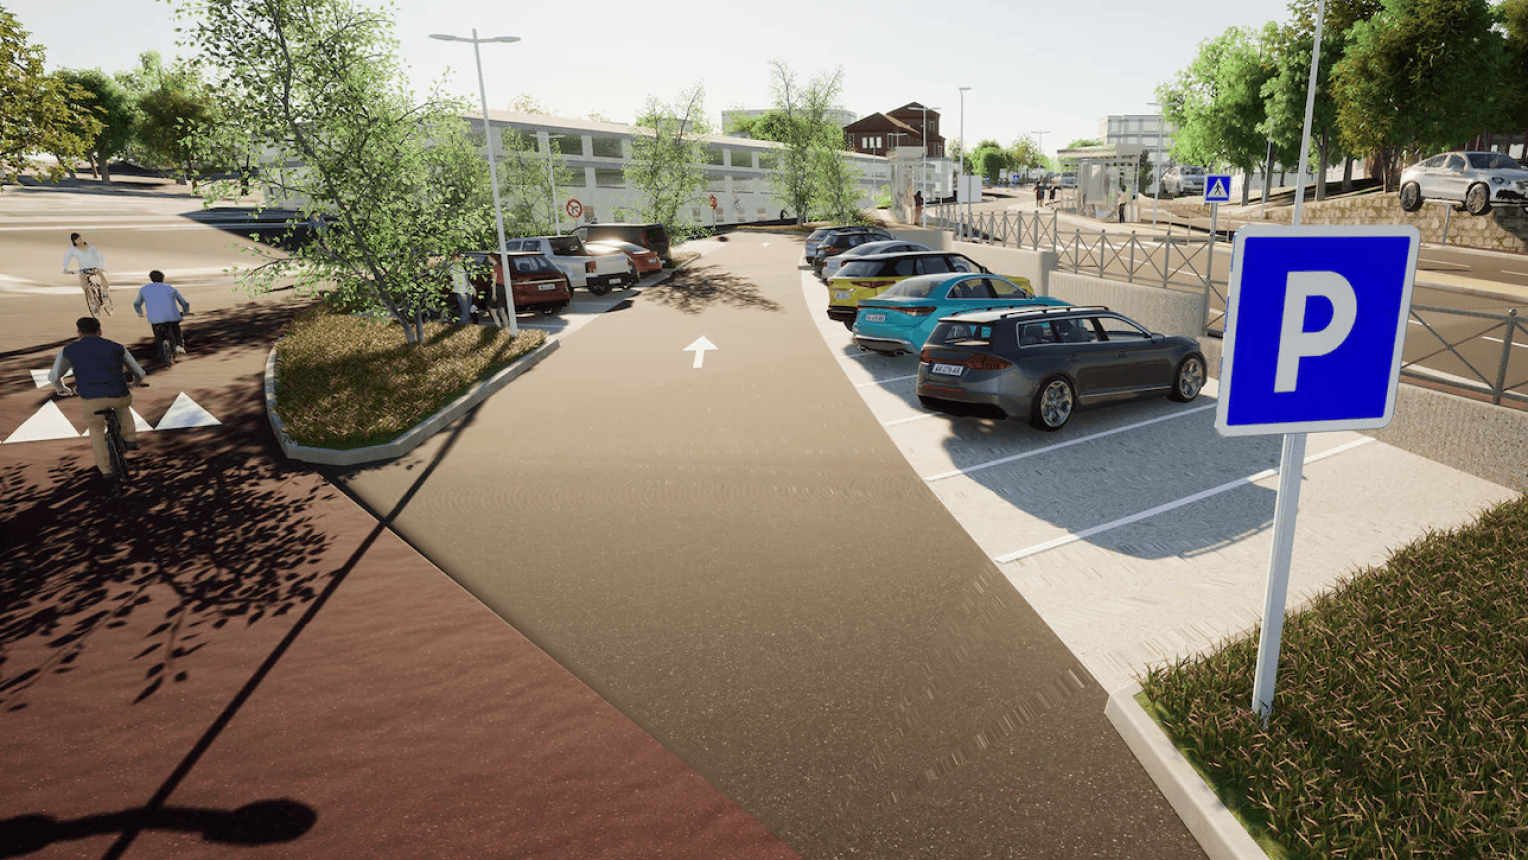
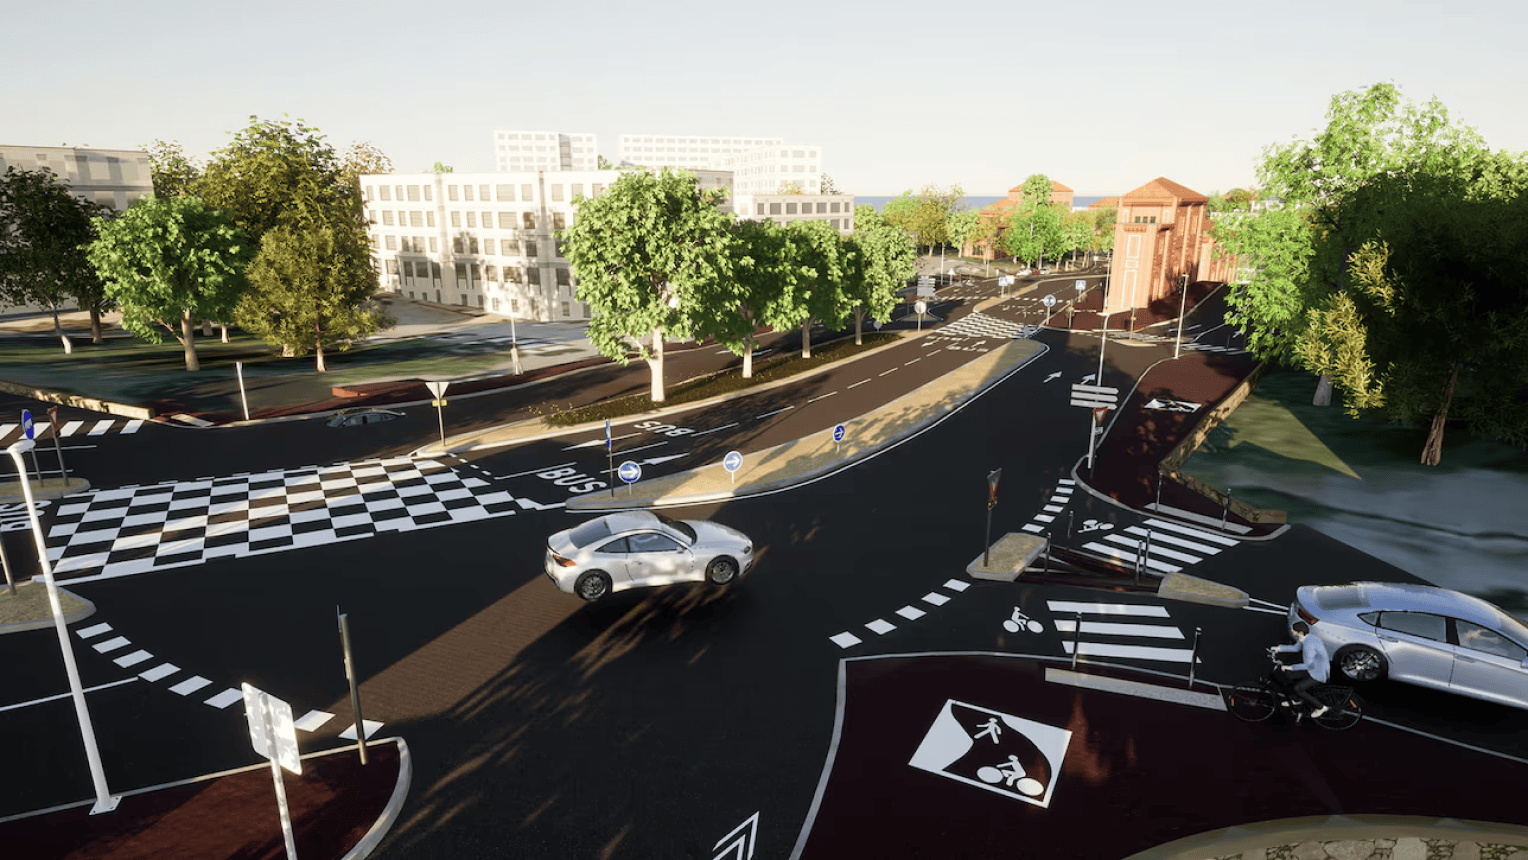
- Twinmotion has been used by Weltzer for almost a year. The program is a perfect fit for urban planning tasks for him. “It’s a fantastic communication tool—it makes it a lot easier for customers and the general public to comprehend the project than old-school tools,” he adds. “You can show anything in three dimensions, with moving cars and plants, as well as realistic lighting and shadows. You can even visualize what the project will look like once it is completed from the perspective of a pedestrian.”
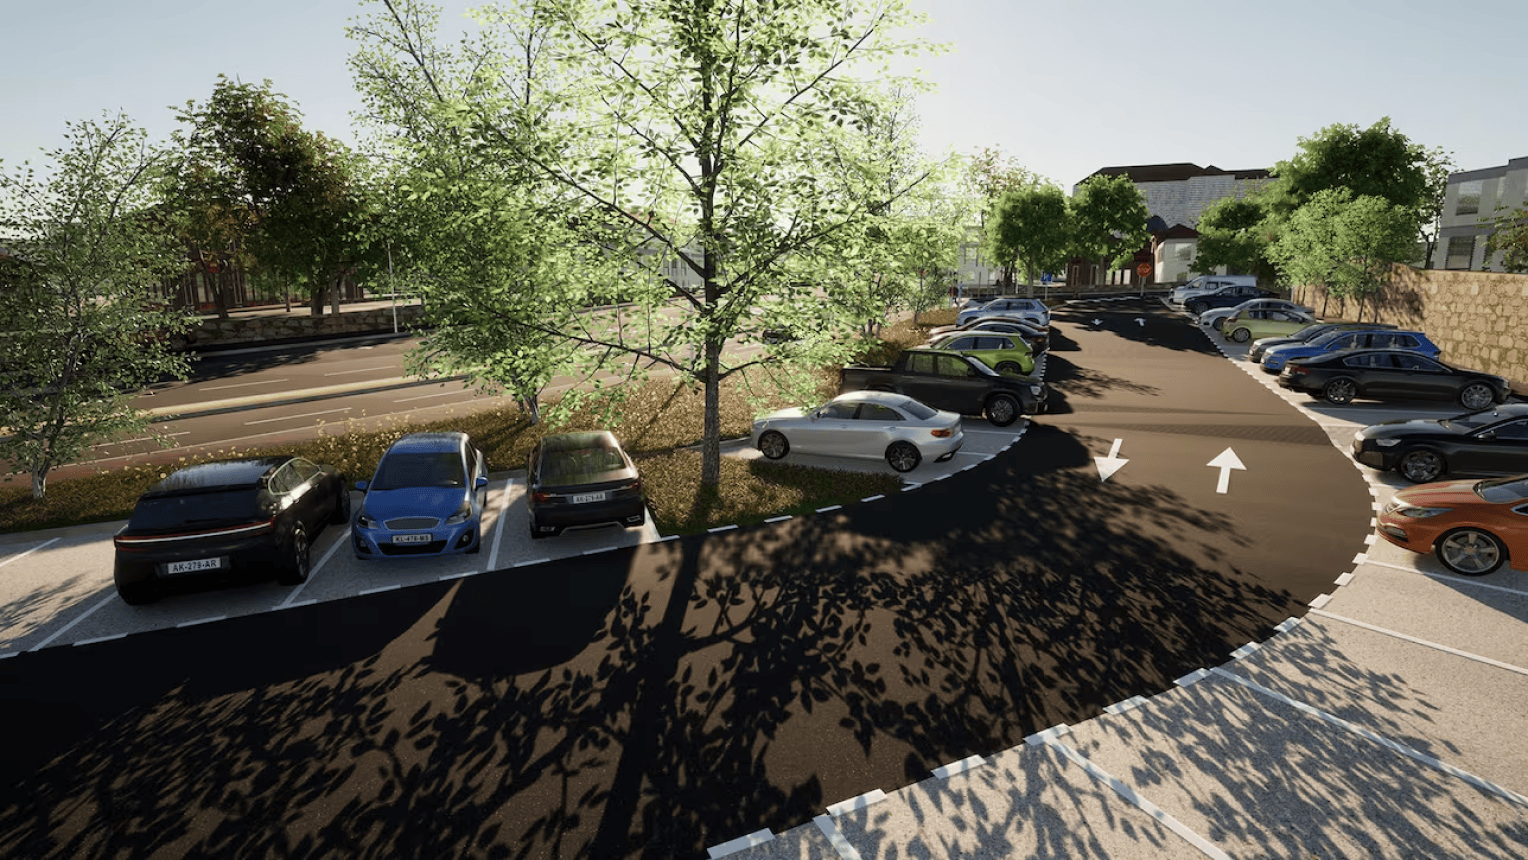
- With all of the data in Twinmotion, Egis was able to use the tool’s robust feature set to bring the visualization to life. It was realistically populated with genuine features such as people and traffic to simulate how traveling along the bus-tram line would feel. “Twinmotion was tremendously helpful in producing the dynamic vehicle trajectories seen in the video,” Weltzer adds. “Moreover, creating the gorgeous and lively greenery with the paintbrush was simple.”
- Because Twinmotion has been designed with ease of use in mind, it enables teams to create visualizations quickly—ideal for meeting tight deadlines. “Twinmotion enabled us to produce photorealistic renderings without spending too much time in production,” says Weltzer. “It’s very user-friendly and has features that are useful and relevant for our projects. “In my opinion, it has the tools best suited for what we do.”
- Egis is one of a number of firms that has recognized it can capitalize on Twinmotion’s fast workflows to deliver big projects like these. Beyond the architects and designers using the tool for residential projects, there’s a growing pool of urban planners and government agencies using Twinmotion to visualize large swathes of urban areas—even entire cities.
- With new updates being made to Twinmotion all the time, project engineers like Weltzer can look forward to even more improvements to their urban planning visualization workflows. “I can’t wait to discover the new features and optimizations you’re working on to make our renderings even better!” he concludes.

Popular Videos
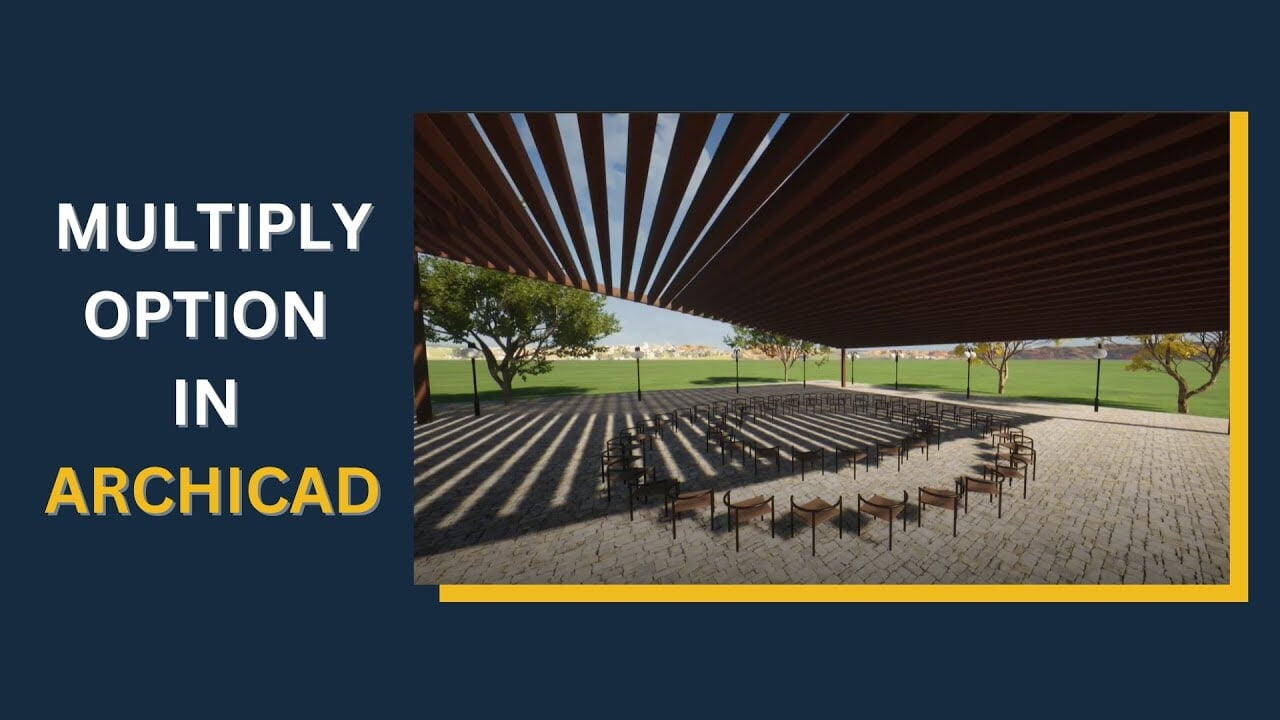
Multiply option in Archicad
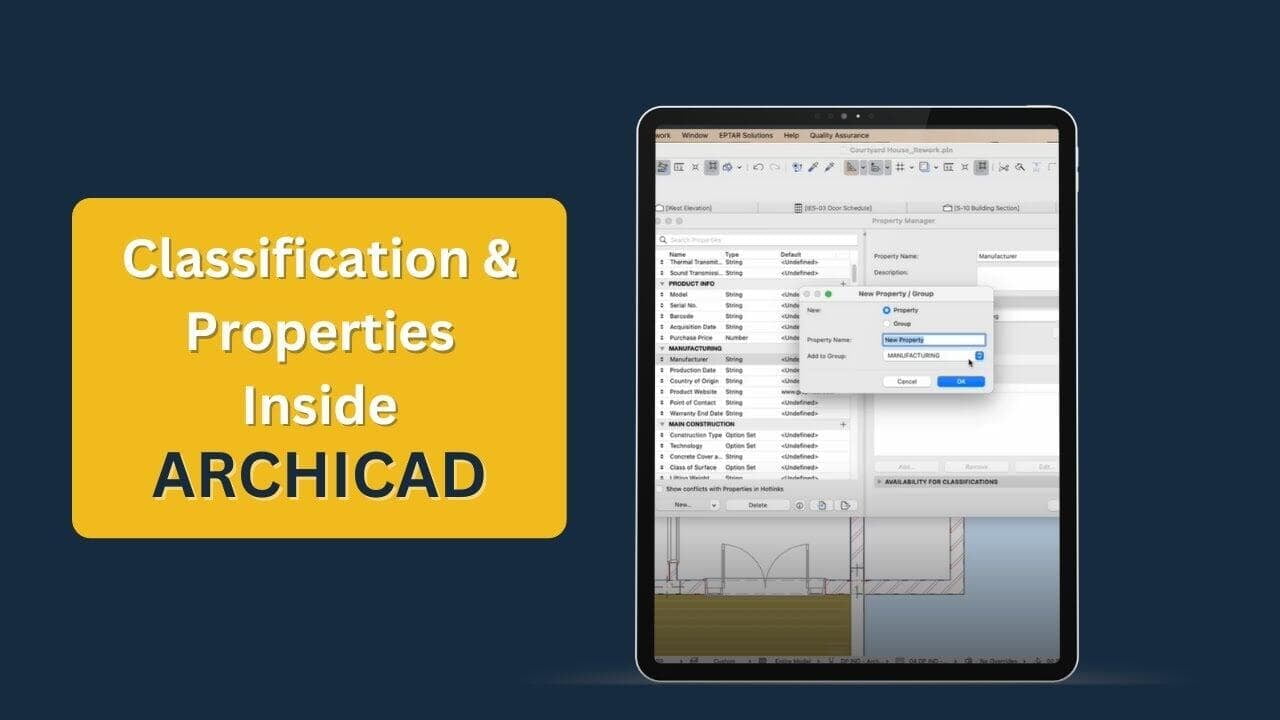
Classification & Properties in Archicad